Amazon Prime Statistics 2023: How Many Amazon Prime Members are There?
Amazon Prime is a paid subscription service from Amazon. It was launched in February 2005 with the aim of creating an online flexible shopping atmospher...
Communication has always been a fabric of human society. The use of signals, verbal communication, and visual media are all ways people communicate with each other.
In a way, communication has evolved over time. Gone are the days when smoke signals, carrier pigeons and cave paintings were used to communicate. By the end of the 1990s, tools such as telephone stations and letters had become established mediums for long-distance communication. Telephone offices are an example of technology that has evolved into landlines, mobile phones and, more recently, smartphones. Undoubtedly, smartphones are better than heavy landline phones.
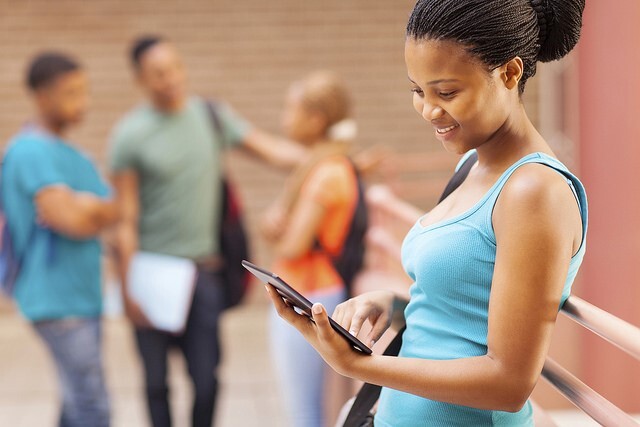
Since the arrival of iPhone in 2007, smartphone use has become an increasingly popular activity. Smartphones, tablets, and other Internet-enabled devices have become indispensable tools for communication, information, and entertainment around the world. The convenience that smartphones have brought to mankind is immeasurable.
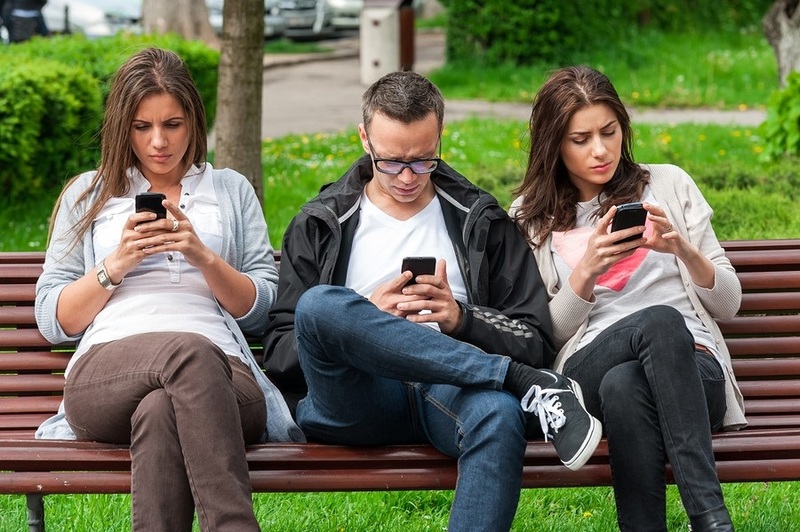
They effectively instantiate communication. People can do a lot with their smartphones these days. There is everything from online courses to online games, shopping to instant his messaging. There are many items in the list. That said, to help you learn more about smartphone users and the trends shaping the future of mobile, we've compiled a list of the latest smartphone data. Let dive right in!
Table Of Contents
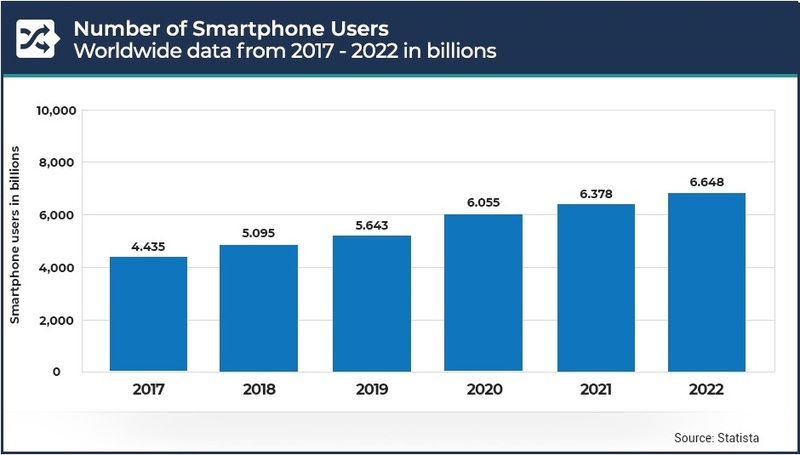
Over the last 20 years, more and more people have started using smartphones. Almost everyone interact and uses a smartphone in some capacity at least once a year. However, there are now more smartphone users than ever before. From 2016 through 2022, the global smartphone market expanded at an average of 10.4% annual, with 2017 seeing the biggest growth (20.9%).
According to predictions, by 2022, there will be 6.6 billion smartphone users worldwide. There will also be 6.8 billion smartphone users worldwide by 2023. By 2026, there will be 7.5 billion smartphone users, assuming current growth rates.
[Source: Techjury, bloggingwizard, Oberlo]
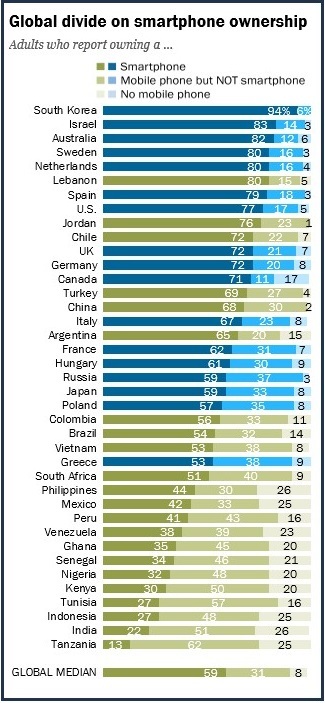
It is obvious that not everyone can afford a phone when comparing smartphone ownership statistics by nation, especially in poorer nations. Following the reports from Gallup World in 2018, 83% of adults in developing nations own a mobile phone. According to PEW Research, 35% of Indians do not own a mobile device, while 40% of the population owns a basic cell phones.
The percentage of people who own smartphones has climbed from 30% to 35% in Ghana, Senegal, and Nigeria in West Africa. According to statistics, barely 4% of adults in Ethiopia and Uganda are smartphone owners also. This shows that more than half of the population of developing countries don't currently use smartphones.
[Source: Review 24 , Bankmycell, The Borgen Project, Brookings]
We would discuss this from the angle of age range and sex given the demographics of smartphone users.
With a shocking 93% usage rate, the 18 to 24 age group uses smartphones more than any other age group. Only 6% of persons in this age group have basic cell phones. Gen Z falls within this umbrella. Among those 65 and older, only 46% use smartphones. A smartphone is available to almost everyone who was born after 1990.
Approximately 80% of men and 75% of women use smartphones, respectively, when it comes to gender. It suggests that men use their smartphones a bit more frequently than women do.
[Source: Review 24 , Deloitte]
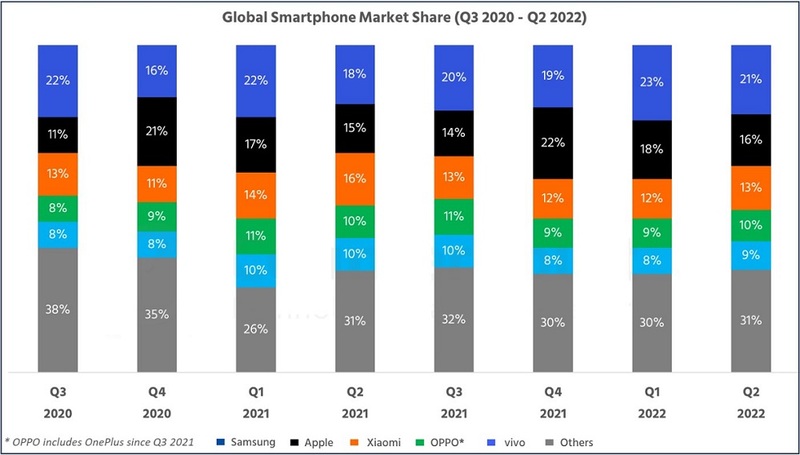
Samsung and Apple are currently the top smartphone producers. About half of all smartphone shipments worldwide are the responsibility of these tech firms. According to data on smartphones worldwide, since 2014, billions of cellphones have been supplied annually. Even though Samsung's shipments were down by 3% year over year.
With a market share increase from the previous quarter's (19% to 23%), Samsung took the lead over Apple in the first quarter of 2022. Apple's shipments decreased also by 1%, reaching 59 million units in the first quarter of 2022. With their respective shipments dropping quarterly and annually, Xiaomi, OPPO, and Vivo kept fighting and following Apple and Samsung.
[Source: Counterpoint]
Over 1.64 billion active mobile users are found in the top five countries, which are China, the United States, Russia, India, and Brazil. Given the exponential rise in smartphone usage, this is crucial for the world economy.
While the United Arab Emirates has the highest smartphone penetration with more than 82.2% of the population using smartphones, China (911.92 million) has the highest smartphone users. With 439.42 million smartphone users, India is second. According to GSMA statistics, the poll also reveals that 64% of smartphone users are Asian.
[Source: Review 24, Bankmycell]
Big changes are happening every day in the world of smartphones. Intense competition among smartphone makers has enabled millions of job opportunities with a wide variety of skills. However, since smartphones are made by fusing various parts such as semiconductors, plastic parts, sensors, cameras, batteries, glass, etc., these tasks can be performed directly or indirectly.
Hence the need for workers. Mobile technology created 11 million new jobs for him in 2015. In India, local manufacturing was a source of employment for about 40,000 people in 2015–2017. By 2021, the mobile ecosystem was projected to employ 60 million people worldwide, 12 million of whom will work directly in the mobile sector.
[Source: Statista, Financial Express, Earthweb, Venture beat]
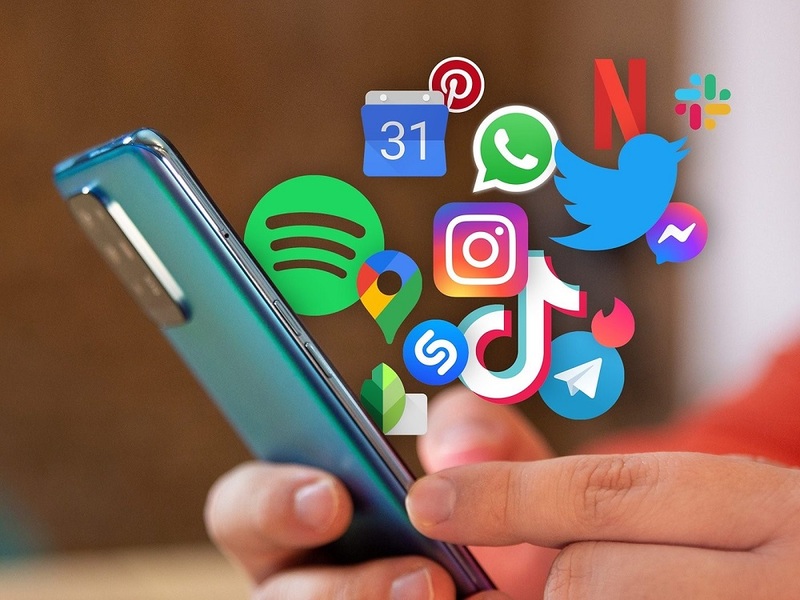
There are different categories of apps people install on their smartphones from app stores. Excluding Gmail, with over 9 million downloads, Google Maps (6.9 billion) and YouTube (10 million), there are basically six common types of apps people install; educational apps, lifestyle apps, social media, productivity, entertainment, and game apps.
Looking at the volume of downloads, some of the most popularly installed apps are games, social media, audio, and audio-video apps. Some of them include WhatsApp, with over 8.413 billion downloads, followed by Facebook with 6.95 billion downloads. Others are Garena Free Fire: Rampage, Instagram, TikTok, etc. This shows that the category of mobile applications that are being installed more frequently are social media apps.
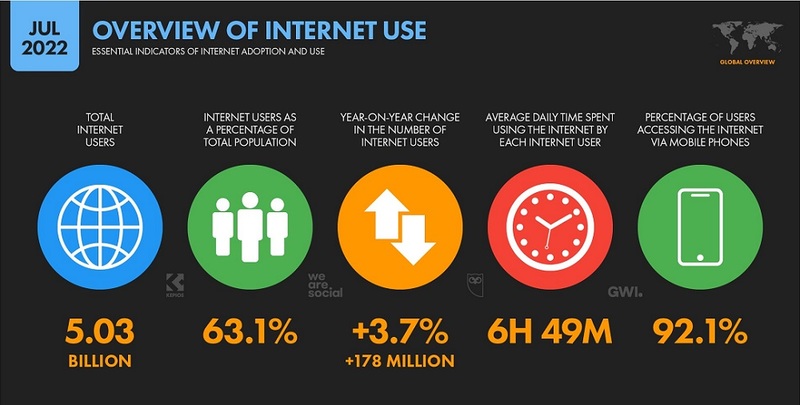
In developing digital economies where mobile networks are the main way to access the internet, this growing trend in mobile internet usage is particularly obvious. Given this, 4.32 billion distinct mobile internet users existed in 2021, suggesting that over 90% of all internet users access the web using mobile devices globally.
Furthermore, according to a recent forecast for the year 2022, 5.03 billion individuals, or 63.1% of the global population, currently use the internet. In the year before July 2022, there may have been an increase in global connectivity of more than 180 million people.
[Source: Statista , Data Reportal]
In our current society, almost everything we do on the internet are possible via our smartphones. Instead of new users joining the smartphone user base, existing smartphone users increased the amount of time they spent using their devices. Smartphone report suggests that 3 hours and 35 minutes on average are spent viewing television.
Generation Z viewers watch smartphone video streaming more frequently than they watch television. In the US in 2021, time spent on mobile devices will account for close to one-third (33.2%) of total media consumption. According to a 2019 survey, US citizens use their smartphones on average for 2 hours and 55 minutes each day.
[Source: Insider Intelligence]
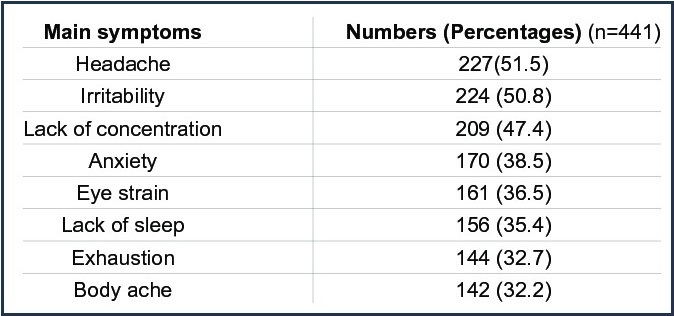
Numerous health issues have resulted from smartphone use. The most frequent symptom of cell phone use among college students, according to research conducted in India, was headache (51.47%), which was followed by irritability/anger (50.79%). Lack of concentration and poor academic performance, sleeplessness, anxiety, etc. are some other typical mental symptoms.
Body aches (32.19%), eye strain (36.51%), and digital thumb (13.8%) were discovered to be common physical complaints. Another American study found that between 2012 and 2015, the prevalence of depression rose by 50% in girls and by 21% in boys. In addition, it showed that self-harm among girls aged 10 to 14 virtually tripled and that rates of juvenile suicide rose by up to 150%.
[Source: Omicsonline, Etactics]
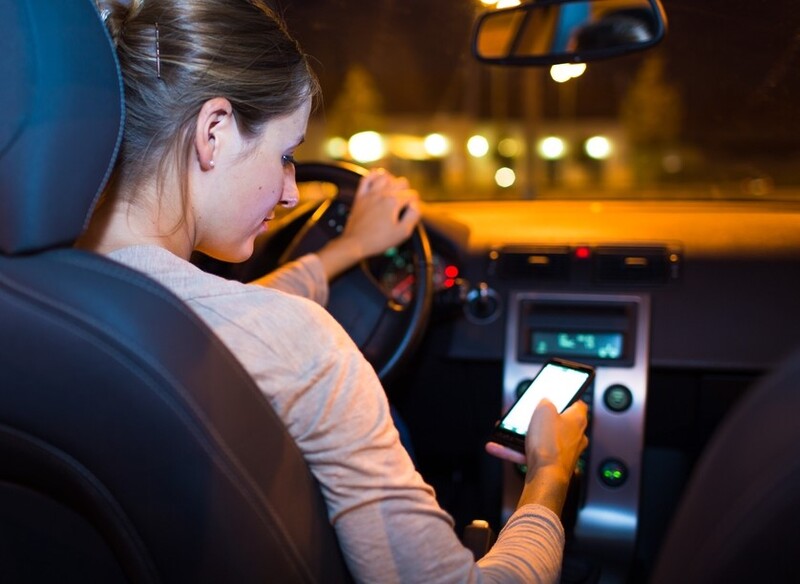
Many people continue to use their cell phones while driving even when they are aware of the risks. NHTSA estimates that 354,415 motorists have been observed driving while holding their phones to their ears.
American drivers use their phones on average for more than an hour in the car, according to a 2019 survey utilizing the driving safety app Drivemode. 16.2% of drivers were reportedly using their mobile phones while driving in 2021, according to reports from "The Zebra," a 2.2% reduction from drivers in 2020. Additionally, it was discovered that women (52.4%) used their phones more while driving than men (47.6%).
[Source: Bankrate, Mashable, The Zebra]
56% of all website traffic worldwide in 2019 came from mobile devices. About 47.7% of web traffic in the United States came from smartphones in the first quarter of 2021. However, there is a large global gap in the amount of mobile internet traffic utilization. Africa is the continent where the majority of internet traffic (69.13%) originates from mobile devices.
Nigeria has the largest percentage of mobile internet traffic, at 81.43%, followed by India with 75.96% and South Africa with 72.59%, according to metrics based on nations. On the other hand, Russia has the lowest percentage of mobile internet traffic (30.2%), followed by Portugal (34.12%) and Canada (37.71%) in terms of percentage.
[Source: Zippia , Exploring Topics]
Mobile traffic converted at 2.25% in 2019 compared to 4.81% for desktop, which is less than half the rate of desktop traffic. In 2019, the average add-to-cart rate for mobile devices was 10.4%, as opposed to 12.9% on desktops. This suggests that consumers were filling their shopping baskets at roughly the same rate. However, the Monette Q1 report 2020 states that the global mobile conversion rate was 1.81%, followed by desktops at 1.98% and mobile and tablets at 2.92%.
However, the mobile conversion rate in the UK is marginally higher than the desktop conversion rate at 3.50% and 3.14% respectively. According to a different Sale Cycle 2022 analysis, smartphone traffic increased to 71% in 2021.
[Source: Salecycle]
According to a recent research, the average monthly mobile data usage has surpassed globally has 10GB. The proliferation of 5G devices, whose users are expected to treble, is a contributing factor in the rise in data usage. For instance, streaming 30 minutes of video per day through sites like Facebook, YouTube, or Netflix consumes more than 5GB of data per month.
Additionally, the Verizon Wireless Data Calculator estimates that 30 days of streaming an hour of music equates to almost 2GB. The average monthly data usage for countries like India is 14.6GB, while the greatest monthly data consumption is 18.4GB for Gulf states including Kuwait, Qatar, Omen, the United Arab Emirates, and Bahrain.
[Source: 9to5mac, NerdWallet]
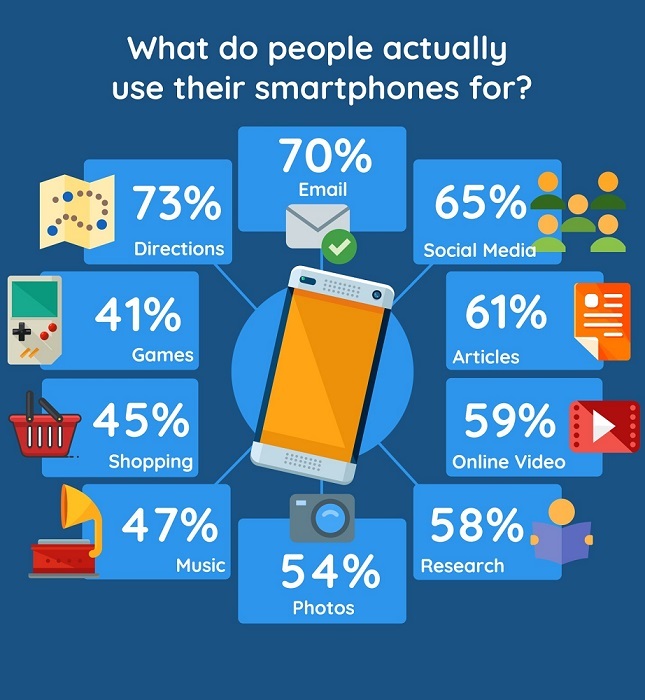
Use cases for mobile devices have changed along with technology. According to reports, smartphones account for 70% of all media time. The internet is transcending all other media, whether it is Netflix streaming or surfing Facebook, Snapchat, Instagram, YouTube, etc. The key component of everything has been smartphones.
Mobile devices are now utilized for a variety of activities, including entertainment, e-commerce, financial management, business meetings, reserving airline tickets, productivity management, and more. However, a recent survey found that gaming is the most popular usage of a mobile device. In actuality, 68% of individuals claim to play video games on their smartphones.
[Source: Exploring Topics]
For more than ten years, there has been a thriving mobile app market that has brought in billions of dollars for Apple, Google, and thousands of other mobile app developers. Apple's App Store brought in approximately $92.1 billion in revenue in 2018. The games generated 76% of the revenue. India, Southeast Asia, and South America are Google Play's biggest international markets.
Apple is also available in China, which has a thriving mobile app market. Apple's iOS saw a 17.7% growth in app and game income in 2021, reaching $85.1 billion, according to the latest App Store Insights report. Google's Play Store saw a 24% increase to $47.9 billion, compared to the previous year.
[Source: BusinessofApps, Techjury]
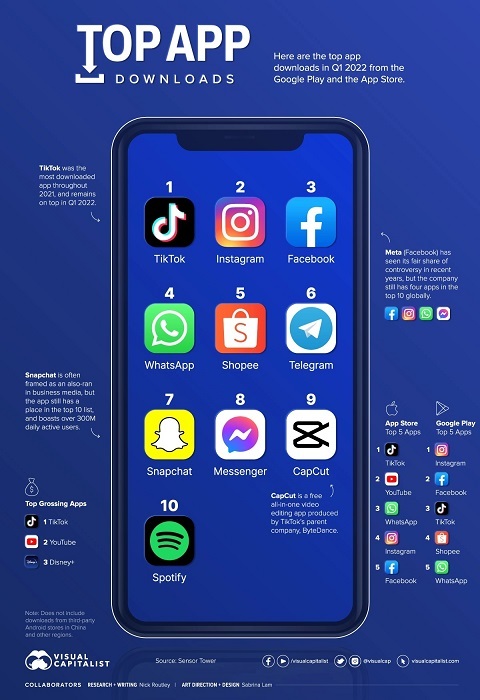
According to Sensor Tower's Data Digest, the number of apps downloaded globally surpassed 36.1 billion in Q4 2021. That translates into an increase of 2.7% from the previous year. 8.3 billion downloads from the App Store and 27.8 billion from Google Play occurred over the same quarter. With 656 million downloads, TikTok was the most popular app worldwide in 2021.
But WhatsApp will continue to be the most downloaded mobile application in 2022. WhatsApp had 2.9 billion downloads in July 2018 and came in third. With 8.41 billion downloads in 2022, it quickly rose to the top. Facebook (6.95 billion downloads), Facebook Messenger (5.67 billion downloads), and Instagram ( 4.197 billion downloads) follow Whatsapp.
[Source: Makeuseof, BusinessofApps]
To better understand their routines and behavior, a survey was conducted among Americans ages 18 and over. 71% of individuals check their smartphones within 10 minutes of waking up, according to a "Reviews.org" survey. 74% of individuals find it difficult to leave their phones at home without getting nervous.
This more clearly demonstrates how dependent many individuals are on their devices. Many people even fall asleep using their phones, only to wake up shortly after and pick them up as their first action. It is regarded as the most valued possession by 45% of Americans.
[Source: Reviews]
2019 saw a global smartphone sales peak of over 1.5 billion units. Over 40% of the world's population was predicted to have access to a smartphone in the same year. However, it was anticipated that the growth in worldwide smartphone sales revenue since 2013 would come to a halt in 2017 at a value of close to $480 billion.
Fortunately, global sales reached $478.7 billion in 2017. However, the merchants didn't generate many sales in 2018. This happened as a result of the brands' models offering no ground-breaking upgrades. However, in 2019, there was more than 1.5 billion smartphones sold globally. Global smartphone sales were estimated to have totaled $448 billion in 2021.
[Source: Statista]
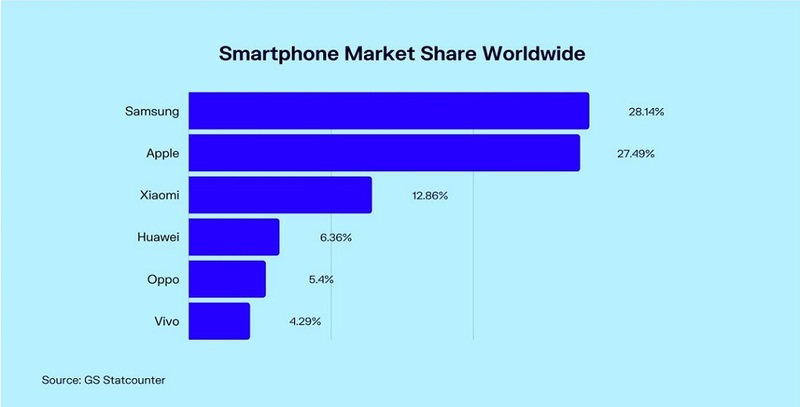
It is hardly surprising that mobile commerce sales are breaking records as the number of smartphone users globally. According to the most recent data on global smartphone market share as of July 2022, Samsung is in the lead with a market share of 28.14%. This indicates that almost 3 out of 10 smartphone users use a Samsung device globally.
Apple is ranked second on the list of the most well-known smartphone manufacturers. Just 0.65% less than Apple, the US phone manufacturer holds a 27.49% market share in smartphones. Xiaomi is the third-largest smartphone brand with a market share of 12.86%. With market shares of 5.4% and 6.36%, respectively, Huawei and Oppo are the next two.
[Source: Oberlo]
As reported by Statista, over 1.5 billion smartphones were sold and distributed worldwide in 2019. More over 40% of people worldwide had access to smartphones in that same year. However, the typical monthly cost of a cell phone plan in 2020 was $113. In 2021, the average price of a smartphone sold worldwide was $363, and more expensive models can cost up to $1,000 (Apple's iPhone 13 Pro costs $1,599).
However, it is anticipated that the average cost of a smartphone in the US consumer market will decrease over the next several years, hitting $550.15 in 2023 and $543.47 in 2025, suggesting that smartphones in the US market may become more affordable.
[Source: Zippia, Investopedia, Statista]
Over the past few years, mobile advertising has grown significantly. In light of this, 64% of SEO marketers consider mobile optimization to be an effective investment, and over 25% of businesses use it as one of their top SEO strategies. According to mobile advertising spending in 2019, the United States was in first place, followed by China.
According to projections from "Omnia," in-app advertisement revenue for non-gaming applications was predicted to increase by 6.2% and for gaming apps by 19.1% in 2021. According to a Statista analysis, mobile advertising is anticipated to slow down to roughly 10.4% by the end of 2022. But this year, it's anticipated that mobile advertising expenditure will top $240 billion.
[Source: Hubspot]
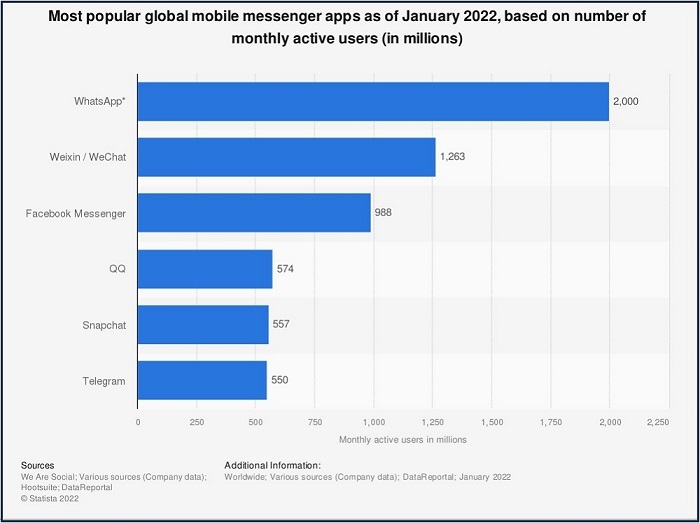
The most popular messaging app, with 2 billion monthly active users, as of 2022 is WhatsApp, according to the most recent statistics. Over time, the number of app users has steadily increased. In India, WhatsApp is most popular. Brazil, the US, Russia, and Indonesia are additional users based on volume. With over 1.3 billion users worldwide, WeChat is WhatsApp's main competitor.
China accounts for the majority of its users. Nevertheless, a small number of companies from countries other than China are downloading the application . Facebook Messenger, with 988 million users, is in the third place. These are the three most popular messaging services are as listed above.
[Source: Oberlo]
Open signal revealed that in 41% of nations, smartphone users had higher speeds on cellular networks than on WiFi when they initially compared the mobile and WiFi internet experiences in 2018. Thankfully, these nations were developing mobile-first markets. In 7 out of 8 of the top 5G nations, 5G is faster than 4G, according to the research, but only in 2 of the countries (Australia and Saudi Arabia).
This means that some nations have stronger internet connections than others, especially with the introduction of the 5G network. South Korea, one of the nations, has a 5G network with the fastest download speed—an average of 438Mbps. Additionally, the average download speed for 5G customers in Saudi Arabia is 414.2 Mbps.
[Source: Statista, OpenSignal]
Given how many people access their email through their phones, it's not surprising that 60% of all email engagement currently occurs when emails are opened on mobile devices. 58% of people check their emails first thing in the morning, compared to 14% who check social media first, according to data on email opening on mobile devices.
According to research, those who check their emails first thing in the morning are thought to be more task-oriented and more likely to be using online interactions with a specific objective in mind. Thus, for 85% of consumers, smartphones are now their primary email checking tool. That rate is much higher, at 90%, for people in the 25–34 age group.
[Source: 99Firms]
The majority of people experience intense anxiety or agitation when they leave the house without their smartphones. There is no doubt that individuals use their phones excessively, ignoring their loved ones and close friends. Even our beds have been invaded by smartphones: 65.7% of people say they sleep with their phones. Reviews recently polled its audience, and it found that 75.4% of respondents admitted to becoming addicted to their phones.
Additionally, according to the most recent workplace statistics, 55% of employers believe that cell phone overuse is the biggest threat to office productivity. The fact that 83% of workers use mobile devices and 82% of them check them while at work scarcely comes as a surprise.
[Source: WebTribunal]
Both Apple's iOS and Google's Android have seen considerable improvements since their respective OS releases in 2007. Google recently introduced Android 12, breaking with tradition after naming its Android iterations after sweets and candy. As of August 2022, this version was present on more than 24% of Android smartphones.
More than 383 million smartphones were sold in Q1 2018—the most ever—with 86.2% of those running Android and 12.9% using iOS. In August 2022, Android remained the most popular mobile operating system worldwide. With a nearly 70% market share, they dominate the mobile operating system space, with iOS accounting for over 28% of the market.
[Source: Statista]
The current percentage of people using social media is 56.8% of the world's total population. However, when we look into platform penetration rates from people in eligible audiences, 93.33% of 4.8 billion global internet users and 85% of 5.27 billion mobile phone users are on social media. It implies that social network platforms have almost tripled their total user base in the last decade, from 970 million in 2010 to a number approaching 4.48 billion users in July 2021.
However, when we look into platform penetration rates from people in eligible audiences, 93.33% of 4.8 billion global internet users and 85% of 5.27 billion mobile phone users are on social media.
[Source: Backlinko]
Compared to mobile web ads, mobile apps convert 3 times more product views. In-app advertising is thus one of the most efficient ways for mobile app owners to make money, according to smartphone statistics for 2020. Mobile advertising offers marketers efficient targeting choices, greater conversion rates, and higher click-through rates.
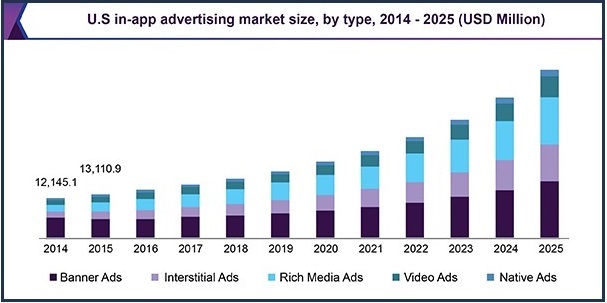
Market share for in-app advertising in 2018 was $67.7 billion. Android smartphones accounted for 49% of monetized mobile in-app ad impressions in 2019, a decrease of 67% from the previous year. In-app advertising touched a record-breaking $201 billion in 2021, and by 2025, it is expected to reach approximately $226 billion.
[Source: Grand View Research, Publift]
One of the most popular platforms in the twenty-first century is YouTube. Globally, they have more than 2 billion users. In 2020, YouTube had over 30 million users who were active every day, and they spent an average of 40 minutes there. Smartphones are the most popular YouTube viewing device worldwide, though.
Three out of four Americans say they watch YouTube on their mobile devices at home, according to "Think with Google." 63% of all YouTube viewing time worldwide was done on mobile devices in the second quarter of 2021. Contrarily, consoles and linked TVs recorded viewing shares that were, respectively, 3% and 14% of the total.
[Source: Statista, Insider Intelligence]
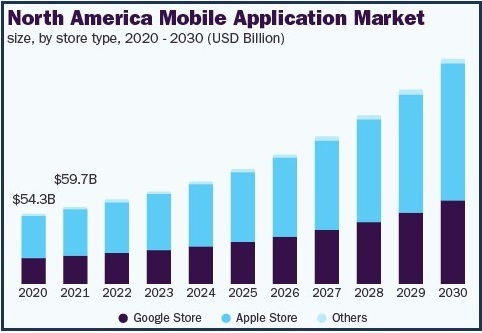
The App market consists the sale of software apps that may be downloaded, installed, and run on mobile devices. More precisely, it refers to apps that can be downloaded through Apple App Store and the Google Play Store. The market for mobile applications was valued at $187.58 billion in 2021, and it is anticipated to increase at 13.4% from 2022 to 2030.
It is anticipated that in-app purchase (IAP) revenue in the app market will reach $200.60 billion in 2022. China produces the most income globally ($146.50 billion in 2022) according to a comparison of countries.
[Source: Grand View Research, Statista]
Mobile commerce is one business that has seen significant growth in revenue. More people than ever before are using tablets and smartphones to access the internet. According to a research, smartphone retail commerce sales would increase to $400 billion by 2024, almost doubling the amount anticipated for 2021.
In the US, mobile commerce sales using smartphones were projected to reach $221.2 billion in 2021. By 2024, the source estimated that smartphone retail commerce sales would exceed $400 billion, more than doubling the amount predicted for 2021. M-commerce revenues via tablets, instead, would stay below $70 billion by 2024.
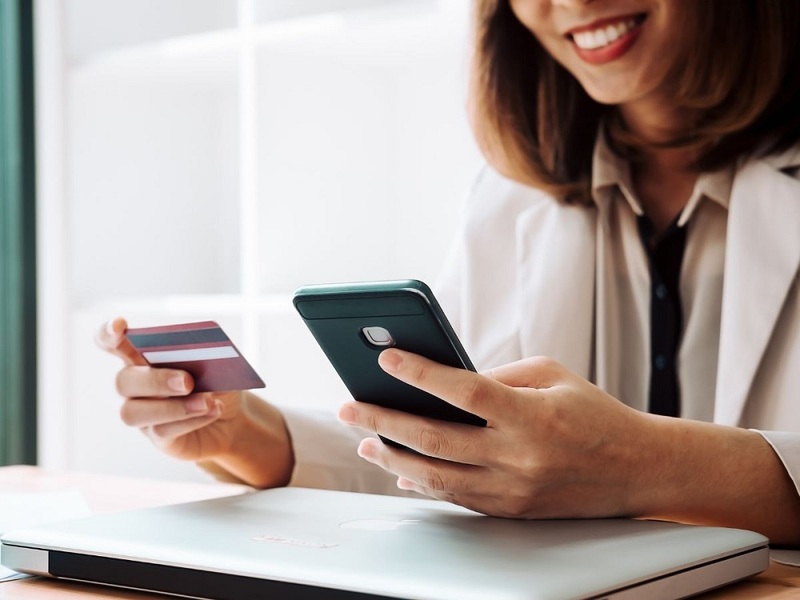
The expansion of the smartphone market has had an impact on numerous businesses and industries. Fintech (payments) and e-commerce are two of the significant industries that have benefited financially from cellphones. Looking at online payment, by the end of 2023, it is predicted that 1.31 billion people would use a mobile payment system for cashless transactions.
According to recent e-marketer research, mobile payments at retailers increased by 29% in the United States in 2019. Businesses that accept Apple Pay payments rose by $6 trillion in 2020 compared to the previous year. The global market for mobile payments is expected to reach $3 trillion by 2024.
[Source: emizentech]
Globally, 7.9 billion people had mobile broadband subscriptions in 2018. According to statistics on smartphone use in 2018, 104% of all mobile subscriptions worldwide were active in the fourth quarter of 2018. According to projections, 8 billion people will have mobile broadband subscriptions by 2022. In the upcoming years, it is expected to increase by several hundred million, according to Statista.
The majority of cell phone subscribers are found in nations like China, India, the US, Brazil, and Russia. Mobile operators' revenue is primarily reliant on tariff services provided through cell phone subscriptions. China has the most smartphone users among these countries with 851 million and the largest selection of providers at over 850.
[Source: Statista, Bankmycell]
People use their smartphones for a variety of activities, including shopping, research, social networking, and more. Our main shopping partners are smartphones. 20% of smartphone users make daily purchases, while 14% make weekly purchases, according to Google's "Our Mobile Planet: Global Smartphone Users" survey.
60% of smartphone users in the US make at least one monthly purchase. Online comments and reviews are better compared to in-store salesmen. As a matter of fact, 67% of men and 54% of women indicated they would pick up their phones before approaching a salesperson for assistance. Dixa's study found that 93% of consumers examine online reviews before making a purchase.
[Source: CXL]
According to reports, 6.4 of the planet's 7.9 billion people own smartphones, but 13% of them (about 1 billion people) don't even have access to electricity, making it difficult for them to charge their devices even if they did. They have trouble charging their devices even when they manage to plug them in. So, unless this unfortunate reality changes, the smartphone industry will probably struggle to reach 90% global penetration.
Sadly, with 44% of users reporting that it regularly bothers them, short battery life is an evident source of worry for U.S. smartphone users. Nearly a third (31%) of people report having a dead smartphone battery every day, and 47% say it happens at least once a week.
[Source: Prnewswire, Bloggingwizard]
Smartphone addiction has developed into a significant issue as users spend more and more time on social media and playing mobile games. Americans check their smartphones an average of 96 times a day, or once every 10 minutes, according to a 2019 survey by "Asurion." Data from 11,000 "RescueTime" users reveals that the majority of people check their phones 58 times per day, according to other studies.
Thirty of those times take place at the office. Most people use their phone for an average of one minute and fifteen seconds once they pick it up. It implies that they pick up the phone on average every hour and 43 minutes.
[Source: Deloitte, TechSpot, ECM]
The gaming industry has witnessed unprecedented growth in recent years. Many individuals have been engaging the internet to play games online. Mobile gaming statistics show that the industry generated total revenue of $180.3 billion by the end of 2021, up +1.4% over the previous year.
Mobile gaming statistics show that above 50% of the people, up to the age of 55 years, reported themselves as committed gamers. According to some estimates, there are now over 300 million mobile online gaming players in India, 1.3 billion in Asia and around 551.7 million in Europe.
[Source: Techjury]
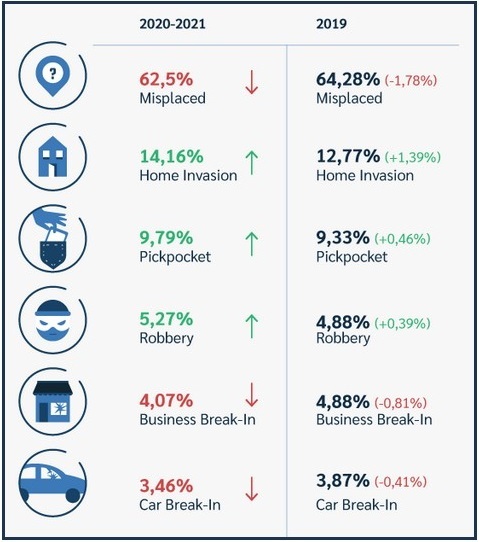
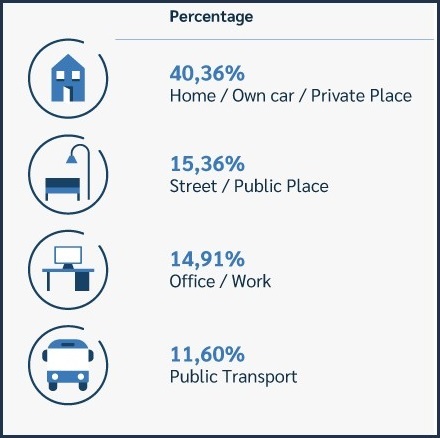
The most frequently lost or forgotten devices are still mobile phones. Despite the fact that many people are smartphone addicts, some of them have lost their phones as a result of pickpockets, home invasions, etc. In the two years between 2020 and 2021, research found that 62.5% of smartphone users lost their devices and 14.16% had their phones stolen by home invasion.
9.79% of persons within this time period had their smartphones stolen by pickpockets. However, compared to the prior year (64.28% in 2019), it was lower for problems like lost phones. Other crimes including home invasions and pickpockets are on the rise (by 9.33% and 12.77%, respectively, in 2019).
[Source: Prey Project]
Smartphones are become a necessary and significant aspect of daily life. With the help of this article, we were able to examine a few turning events in the development of smartphones. We've also been able to weigh certain advantages and disadvantages of owning a smartphone. We believe you have been able to study smartphone users' actions and the trends reshaping the market with this article.